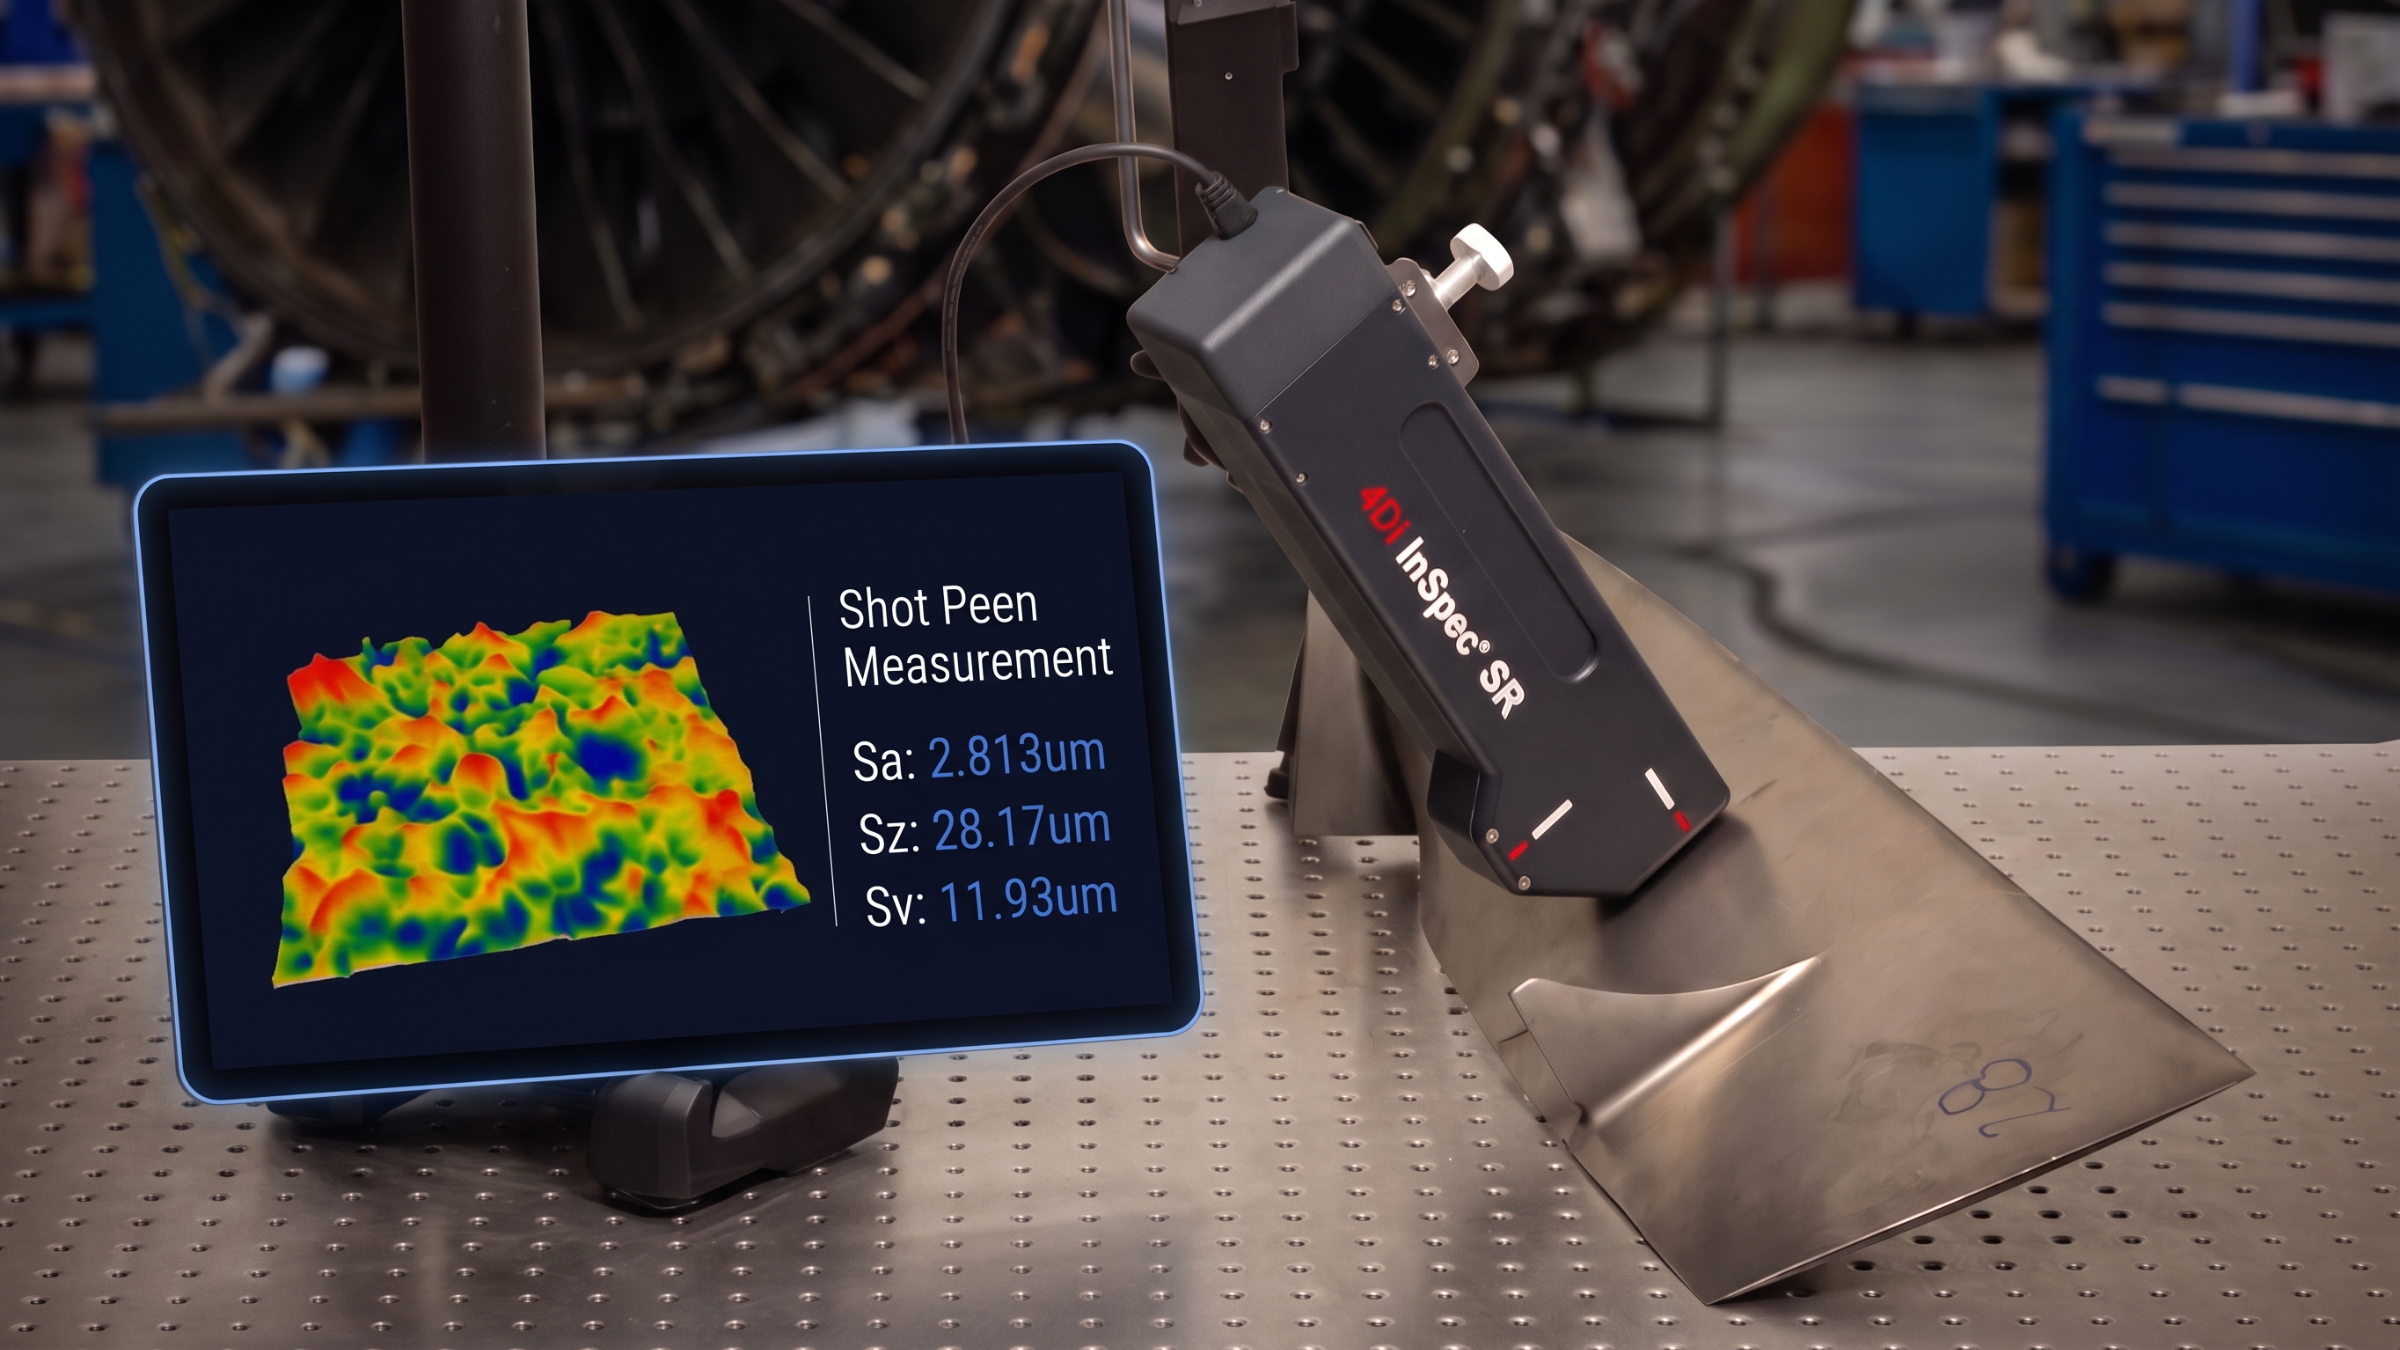
Why Surface Roughness Specifications Are Shifting from Ra to Sa
Surface roughness directly impacts sealing performance, friction, wear, coating adhesion, fatigue life, and overall product quality. Yet many manufacturing specifications still rely on Ra, a parameter developed nearly a century ago from a single 2D measurement trace. As modern surfaces become increasingly engineered and complex, manufacturers are discovering that traditional roughness measurements do not always provide the complete picture.
History of Ra
The need to quantify surface roughness first emerged in the early 20th century as manufacturers sought objective ways to resolve disputes over surface finish quality. Prior to standardized measurement methods, surface quality was often judged subjectively through visual inspection or simple tactile assessments. The introduction of stylus-based instruments in the 1930s marked a significant advancement, providing one of the first standardized quantitative approaches to surface roughness measurement.
These instruments worked by physically dragging a sharp stylus tip along a surface, typically perpendicular to the main machining direction, creating a simple single-line profile of height variations to generate a roughness profile. This resulted in a 2D measurement quantified using R parameters, with average roughness from this method known as Ra. Ra worked particularly well for common CNC machining processes such as turning and milling, where there is a well-defined direction to the surface texture. Because it was easy to standardize and communicate, Ra quickly became the industry standard.
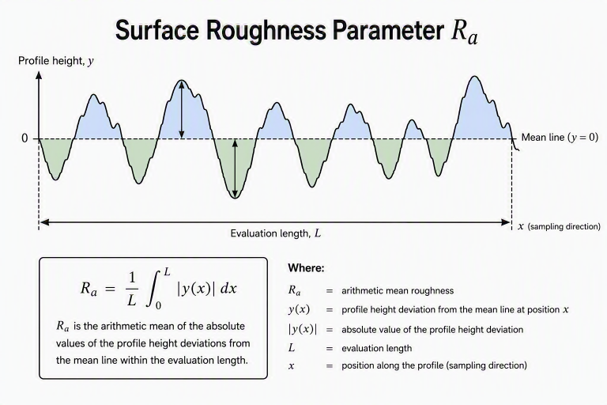
When Surfaces Outgrew a Single, 2D Trace and Started Shifting to 3D
Over the past several decades, however, surfaces have become increasingly advanced due to growing demands for manufacturing efficiency and performance. They began to be engineered for specific functional purposes such as sealing performance, friction control, coating adhesion, and extended component life. This increased the importance of roughness parameters, but also introduced greater complexity, as surfaces were now textured in multiple directions or featured more unique, non-uniform patterns.
These advancements have exposed some of the inherent limitations of relying on a single, directional, 2D stylus profile measurement. Depending on where the measurement is taken on a variable surface, different traces on the same surface can produce significantly different Ra values.
The Rise of 3D Metrology and the Sa Parameter
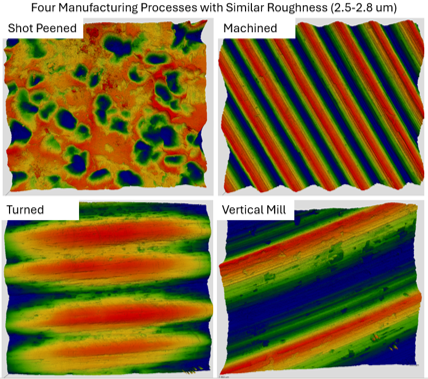
During this time, it became clear that a transition toward 3D measurement was necessary to more accurately characterize these variations in surface texture. Early attempts to address this using existing tools involved approximating 3D data with stylus-based systems by combining multiple adjacent 2D traces into an areal dataset. While this approach is still used today, it presents several drawbacks. The most significant challenge is long measurement times, often requiring an hour or more to achieve high lateral resolution in both directions. Additionally, the method requires a skilled operator and is susceptible to variation between scans due to mechanical drift repositioning errors.
Because of these drawbacks, optical scientists began searching for a better alternative. In the late 1980s, the first true 3D, optical surface measurement systems were developed. They used interferometry-based techniques, which measure surface height by analyzing light interference patterns, enabling the creation of full areal surface profiles and rapid topographical analysis. These systems introduced S parameters, which allowed users to describe surface characteristics far more comprehensively than traditional R parameters as well as predict performance more reliably. One of the most direct comparisons is the average surface roughness, where the areal parameter Sa, calculated over a surface area rather than a single line, is an extension of Ra. S parameters enable manufacturers to develop a more complete quantitative understanding of surface features, including waviness, texture direction, wear behavior, microroughness, and fluid retention capability.
The 3D datasets produced by these systems are significantly more robust, providing detailed insight into both surface height variations and spatial texture characteristics that cannot be captured in a single 2D trace. As a result, Ra becomes an increasingly insufficient descriptor of surface quality in comparison. Given these clear advantages, an important question remains: why is Ra still so widely used today?
Why Ra Persists
Ra has remained the industry standard primarily because of legacy adoption, simplicity, and cost. It has been embedded in engineering drawings, standards, and supplier requirements for decades, making it difficult and expensive to change despite its shortcomings. This has resulted in a vast amount of historical data, process validation, and institutional knowledge tied specifically to Ra values. Another key factor is that stylus instruments used to measure Ra are relatively low-cost and well-suited for production environments, further reinforcing its continued use. This reliance on Ra is driven more by historical momentum and practicality than by technical superiority.
The Ra to Sa Correlation Myth
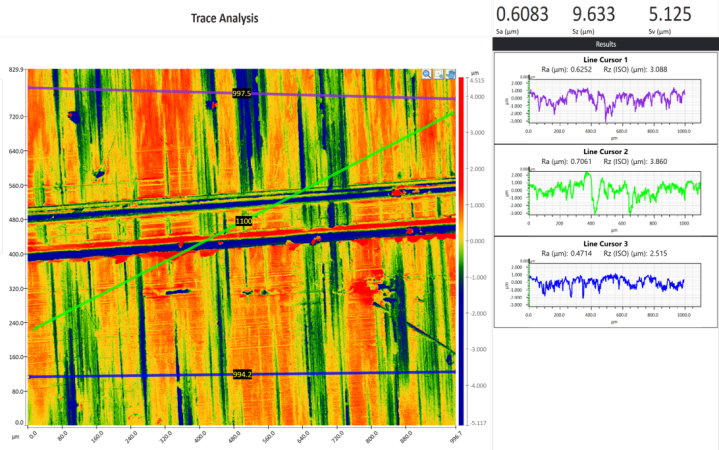
Another reason for its persistence is the common belief that Ra can be correlated directly to Sa. In many cases, users expect a simple 1:1 relationship between Ra and Sa which isn’t always realistic. As mentioned earlier, when attempting to approximate true 3D optical Sa measurements using multiple Ra traces, operators typically collect multiple traces in a single direction. Because these traces are taken along one axis, the resulting value may approximate the surface under certain conditions, but it cannot fully represent the areal texture regardless of how many lines are measured. For surfaces that are relatively uniform in all directions, the difference between Ra and Sa may appear small. However, for surfaces with directional textures or complex features, the discrepancy between the two can become significant.
To illustrate this, consider a surface with a milled finish. If this surface is measured using traces in the Y (vertical) direction, the variations caused by the horizontal milling pattern will be captured in every trace. In this case, the optically measured Sa and the Y-direction stylus Ra may appear very similar.
However, if the traces are instead collected in the X (horizontal) direction, parallel to the milling pattern, the measured height variations along each trace will be minimal. This effectively ignores the dominant surface structure, resulting in a X-direction Ra value that differs significantly from the true 3D Sa measurement. In this case, the resulting average is not representative of the actual surface variation.
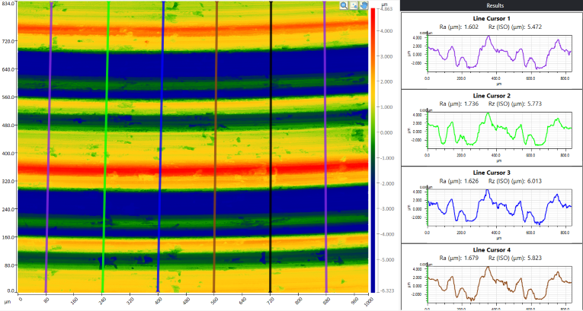
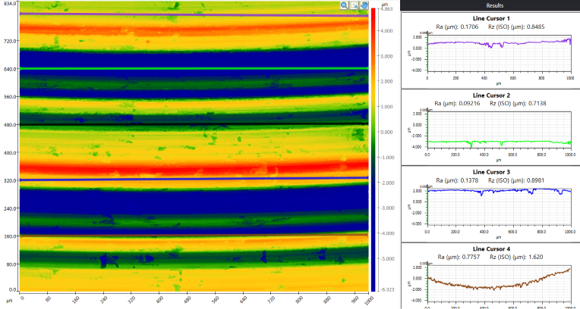
Importantly, this issue is not limited to highly directional surfaces. Even surfaces with more random or isotropic textures can exhibit variability in Ra depending on trace location and orientation. The following examples demonstrate how surfaces that appear similar in all directions can still produce inconsistent results when measured using stylus-based methods
Getting Sa out of the Lab
While it is clear that Sa provides a more complete and accurate representation of surface topography than Ra, the question comes up again for why it hasn’t been universally adopted. The primary way that these Sa measurements are taken is with an optical profiler. While powerful, traditional optical profilers are limited by their size, cost, and sensitivity to environmental conditions such as vibration, cleanliness, and reflectivity. These constraints make them less practical for many production environments, especially when measurements need to be performed quickly, on the shop floor, or in less controlled settings. As a result, even though Sa offers clear technical advantages, the accessibility and usability of the measurement systems have slowed its broader adoption.
This is where a new class of instrumentation is beginning to change the equation. Advances in optical metrology have enabled systems capable of generating high-quality 3D surface profiles in a more portable form factor; retaining the accuracy and richness of traditional lab-based measurements while addressing the practical limitations that have historically restricted their use.
Bringing 3D and Sa to the Shop Floor: 4Di InSpec SR
4D Technology introduced one of the earliest implementations of this concept with the 4D InSpec nearly a decade ago. The 4D InSpec is a non-contact, vibration-insensitive handheld interferometer primarily used for rapid, portable defect inspection. While highly effective for applications such as defect detection and edge break analysis, it does not offer the vertical resolution required for ultra-fine surface roughness measurements.
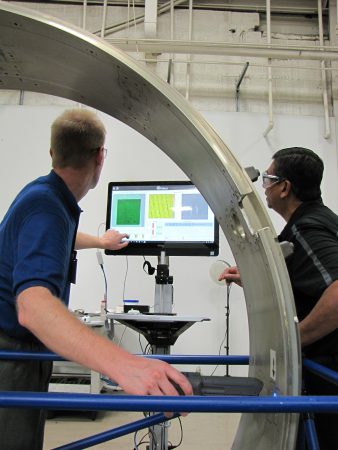
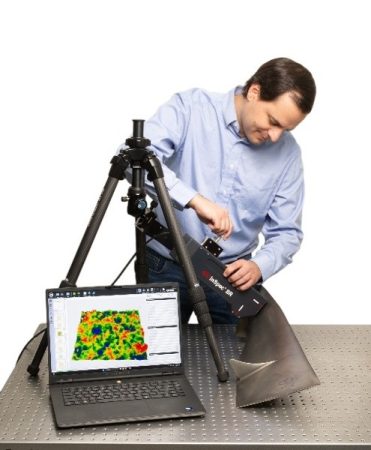
In 2026, 4D Technology introduced the 4Di InSpec SR, designed from the ground up specifically for surface roughness measurement. It enables measurement sensitivity down to 12 nm Sa while maintaining the same vibration insensitivity and portability. This makes it possible to capture accurate 3D roughness data directly on the shop floor by combining the advantages of Sa with the speed and accessibility required for modern manufacturing environments. This means enabling faster process feedback, improved quality control, and more reliable surface characterization.
While the advantages of Sa are clear, transitioning from Ra still presents real and understandable challenges. The primary issue is that, as discussed earlier, organizations have built years of historical data, acceptance limits, and performance benchmarks around Ra values. Fortunately, the 4Di InSpec SR software includes features designed to make this transition as seamless as possible. Even for legacy measurements based on Ra, the system allows users to take a 3D measurement and overlay 2D traces directly onto the dataset. Trace position, height, and width can be adjusted to obtain accurate Ra measurements from the 3D scan. This capability provides a bridge between legacy 2D measurements and modern 3D analysis within a single dataset.
The Future of Surface Metrology
As manufacturing processes and functional surface requirements have evolved, the limitations of relying on a single 2D profile have become increasingly apparent. Modern surfaces are more complex, more application-driven, and require a deeper understanding of their full texture and spatial characteristics. 3D areal parameters such as Sa offer a more complete and reliable representation of surface roughness, capturing critical information that 2D measurements inherently miss. While attempts to correlate Ra and Sa may work under limited conditions, they ultimately fail to provide a consistent or universal relationship. As a result, continuing to rely solely on Ra introduces risk in accurately characterizing and controlling surface performance.
At the same time, adoption of 3D metrology has historically been constrained by practical limitations such as cost, complexity, and lack of portability. With the introduction of portable optical systems like the 4Di InSpec SR, these barriers are effectively removed. Manufacturers can now access high-resolution, areal surface data directly on the shop floor, enabling faster decisions, improved process control, and more meaningful surface characterization. As portable 3D metrology becomes more accessible, Sa is positioned to move from a specialized metric to a standard tool for modern manufacturing. Ultimately, the shift from Ra to Sa is not just a change in parameters, but a progression toward more accurate, data-driven surface metrology.
For more information: www.4dtechnology.com
Application Note: Characterizing Surface Quality: Why Average Roughness (Ra) Is Not Enough | Bruker
Sa does not equal Ra! – Michigan Metrology